Back to RasterLite2 Tutorials index
Tutorial: adding a styled DEM to the Planet Earth sample
In this tutorial we'll use the following input Open Data datasource: please download it right now.- ETOPO1: a raw Global Relief Model released from NOAA.
Now you'll use exactly the same identical dataset, but this time you'll learn how to directly access a raw DEM, and how to apply your own custom styles to it.
You'll possibly use yet again the same earth.sqlite DB-file used in the previous Planet Earth tutorial, and this will allow you to immediately perceive any relevant difference between these two different approaches.
Step 1) retrieve all basic informations about the ETOPO1 DEM
$ tiffinfo ETOPO1_Ice_c_geotiff.tif
TIFF Directory at offset 0x8 (8)
  Image Width: 21600 Image Length: 10800
  Bits/Sample: 16
  Sample Format: signed integer
  Compression Scheme: None
  Photometric Interpretation: min-is-black
  Samples/Pixel: 1
  Rows/Strip: 1
  Planar Configuration: single image plane
  Tag 33550: 0.016667,0.016667,0.000000
  Tag 33922: 0.000000,0.000000,0.000000,-180.000000,90.000000,0.000000
  Tag 42112: <GDALMetadata>
  <Item name="NC_GLOBAL#Conventions">COARDS/CF-1.0</Item>
  <Item name="NC_GLOBAL#title">ETOPO1_Ice_c_gmt4.grd</Item>
  <Item name="NC_GLOBAL#history">grdsample -V ETOPO1_Ice_g_gmt4.grd -GETOPO1_Ice
_c_gmt4.grd=ni -T</Item>
  <Item name="NC_GLOBAL#GMT_version">4.4.0</Item>
  <Item name="NC_GLOBAL#node_offset">1</Item>
  <Item name="z#long_name">z</Item>
  <Item name="z#_FillValue">-2147483648</Item>
  <Item name="z#actual_range">-10803, 8333</Item>
  <Item name="x#long_name">Longitude</Item>
  <Item name="x#actual_range">-180, 180</Item>
  <Item name="x#units">degrees</Item>
  <Item name="y#long_name">Latitude</Item>
  <Item name="y#actual_range">-90, 90</Item>
  <Item name="y#units">degrees</Item>
  <Item name="NETCDF_VARNAME" sample="0">z</Item>
</GDALMetadata>

  Tag 42113: -2147483648
$
As reported by the tiffinfo tool, this TIFF file contains a 21,600 x 10,800 raster; the suggested photometric interpretation is Grayscale (min-is-black), and pixel values are of the INT16 type (Sample Format: signed integer and Bits/Sample: 16).
Please note: since now you've constantly encountered unsigned integer samples; but ETOPO1 is a Global DEM covering both Continent surfaces and Ocean floors, and each pixel value corresponds to an elevation measure. So in this specific case using signed integers is a perfectly reasonable solution, because we'll have positive elevations above sea level and negative elevations below sea level.
$ listgeo ETOPO1_Ice_c_geotiff.tif
Geotiff_Information:
   Version: 1
   Key_Revision: 1.0
   Tagged_Information:
      ModelTiepointTag (2,3):
         0                 0                 0
         -180              90                0
      ModelPixelScaleTag (1,3):
         0.0166666666666667 0.0166666666666667 0
      End_Of_Tags.
   Keyed_Information:
      End_Of_Keys.
   End_Of_Geotiff.
$
The listgeo tool confirms that this actually is GeoTIFF: unhappily it's a bogus GeoTIFF, missing to declare many relevant informations (e.g. the intended Reference System). So it's practically useless.
0.0166666666666667
0.00000
0.00000
-0.0166666666666667
-180.00000
90.00000
Anyway this isn't a blocking issue: you could easily add by yourself a WorldFile supporting the TIFF (as exemplified in the above snippet); or you could eventually just download it from here.
Step 2) creating the Etopo1_DEM Coverage
$ rl2tool CREATE -db earth.sqlite -cov Etopo1_DEM -smp INT16 \
-pxl DATAGRID -cpr LZMA -srid 4326 -res 0.0166666666666667 -nd -9999

rl2_tool: request is CREATE
===========================================================
              DB path: earth.sqlite
             Coverage: Etopo1_DEM
          Sample Type: INT16
           Pixel Type: DATAGRID
      Number of Bands: 1
        NO-DATA pixel: -9999
          Compression: LZMA (7-zip, lossless)
   Tile size (pixels): 512 x 512
                 Srid: 4326
Pixel base resolution: X=0.0166666666666667 Y=0.0166666666666667
===========================================================

     SQLite version: 3.8.4.2
 SpatiaLite version: 4.2.0-devel
RasterLite2 version: 0.8

Raster Coverage "Etopo1_DEM" successfully created

Operation CREATE successfully completed
$
- Exactly as you already did in any previous tutorial you'll invoke rl2tool from the command shell.
- the most relevant arguments will be explained one by one:
- -smp INT16 this specifies the Coverage's Sample Type.
- -pxl DATAGRID this specifies the Coverage's Pixel Type.
- -cpr LZMA this specifies that all Tiles in this Coverage must be compressed using the lossless LZMA algorithm.
Please note: in this case using the common JPEG compression is completely out of discussion, because JPEG doesn't support 16 bit pixels.
Step 3) populating the Etopo1_DEM Coverage
$ rl2tool IMPORT -db earth.sqlite -cov Etopo1_DEM -srid 4326 -wf \
-src ETOPO1_Ice_c_geotiff.tif -pyr

rl2_tool; request is IMPORT
===========================================================
              DB path: earth.sqlite
    Input Source path: ETOPO1_Ice_c_geotiff.tif
             Coverage: Etopo1_DEM
              Section: from file name
Using the WorldFile
          Forced SRID: 4326
Immediately building Pyramid Levels
===========================================================

     SQLite version: 3.8.4.2
 SpatiaLite version: 4.2.0-devel
RasterLite2 version: 0.8

Importing: ETOPO1_Ice_c_geotiff.tif
------------------
    Image Size (pixels): 21600 x 10800
                   SRID: 4326
       LowerLeft Corner: X=-180.00 Y=-90.00
      UpperRight Corner: X=180.00 Y=90.00
       Pixel resolution: X=0.0166666666666667 Y=0.0166666666666667
  ----------
    Pyramid levels successfully built for: ETOPO1_Ice_c_geotiff

Operation IMPORT successfully completed
$
Exactly as you already did in any other previous tutorial.
Step 4) creating and loading your own custom Raster Styles
4.1) downloading the ETOPO1 styles
Just download the appropriate resource-pack from here; it contains any SLD/SE RasterSymbolizer required by this tutorial.4.2) exploring the SLD/SE RasterSymbolizer anatomy
<?xml version="1.0" encoding="UTF-8"?>
<RasterSymbolizer version="1.1.0"
		xsi:schemaLocation="http://www.opengis.net/se http://schemas.opengis.net/se/1.1.0/Symbolizer.xsd"
		xmlns="http://www.opengis.net/se"
		xmlns:ogc="http://www.opengis.net/ogc"
		xmlns:xlink="http://www.w3.org/1999/xlink"
		xmlns:xsi="http://www.w3.org/2001/XMLSchema-instance">
	<Name>etopo</Name>
	<Description>
		<Title>ETOPO1 Color Map</Title>
		<Abstract>derived from the original "etopo2" color rule (GRASS GIS)</Abstract>
	</Description>
	<Opacity>1.0</Opacity>
	<ColorMap>
		<Interpolate fallbackValue="#ffffff">
			<LookupValue>Rasterdata</LookupValue>
			<InterpolationPoint>
				<Data>-11000.00000000</Data>
				<Value>#000000</Value>
			</InterpolationPoint>
			<InterpolationPoint>
				<Data>-5000.00000000</Data>
				<Value>#000064</Value>
			</InterpolationPoint>
			<InterpolationPoint>
				<Data>-1000.00000000</Data>
				<Value>#3232c8</Value>
			</InterpolationPoint>
			<InterpolationPoint>
				<Data>-1.00000000</Data>
				<Value>#9696ff</Value>
			</InterpolationPoint>
			<InterpolationPoint>
				<Data>0.00000000</Data>
				<Value>#009600</Value>
			</InterpolationPoint>
			<InterpolationPoint>
				<Data>270.00000000</Data>
				<Value>#5aa55a</Value>
			</InterpolationPoint>
			<InterpolationPoint>
				<Data>300.00000000</Data>
				<Value>#5aaf5a</Value>
			</InterpolationPoint>
			<InterpolationPoint>
				<Data>500.00000000</Data>
				<Value>#32b432</Value>
			</InterpolationPoint>
			<InterpolationPoint>
				<Data>500.00000000</Data>
				<Value>#46aa46</Value>
			</InterpolationPoint>
			<InterpolationPoint>
				<Data>1000.00000000</Data>
				<Value>#46914b</Value>
			</InterpolationPoint>
			<InterpolationPoint>
				<Data>1000.00000000</Data>
				<Value>#469b4b</Value>
			</InterpolationPoint>
			<InterpolationPoint>
				<Data>2000.00000000</Data>
				<Value>#969c64</Value>
			</InterpolationPoint>
			<InterpolationPoint>
				<Data>3000.00000000</Data>
				<Value>#dcdcdc</Value>
			</InterpolationPoint>
			<InterpolationPoint>
				<Data>4000.00000000</Data>
				<Value>#f5f5f5</Value>
			</InterpolationPoint>
			<InterpolationPoint>
				<Data>8850.00000000</Data>
				<Value>#ffffff</Value>
			</InterpolationPoint>
		</Interpolate>
	</ColorMap>
</RasterSymbolizer>
You've already got few basic notions about RasterSymbolizer during the previous Trieste and Orbetello tutorials: now we'll examine a different Symbolizer, i.e. ColorMap:
- a Color Map simply represents a lookup table. You can freely define one (or possibly more than one) intervals, and in the output image each pixel will then receive the appropriate color matching the corresponding interval.
- Recall: the ETOPO1 sample is a Digital Elevation Model and each pixel value corresponds to an elevation measure. So you can now define as much elevation intervals as you wish, and each interval will correspond to some color of your choice.
- ColorMap supports two different flavors:
- Interpolate intends that each interval has a start and a stop color: the actual pixel color will then be the one precisely matching the corresponding color gradient.
- Categorize on the other hand intends that any pixels value matching an interval will always be represented by the same identical color.
4.3) importing all RasterSymbolizers into the DB-file
$ sqlite3 earth.sqlite
SQLite version 3.8.4.2 2014-03-26 18:51:19
Enter ".help" for usage hints.
sqlite> .null NULL
sqlite> SELECT load_extension('mod_spatialite');
NULL
sqlite> SELECT CreateStylingTables();
1
sqlite> SELECT RegisterRasterStyledLayer('etopo1_dem',
   ...> XB_Create(XB_LoadXML('./etopo1_styles/etopo.xml'), 1, 1));
1
sqlite> SELECT RegisterRasterStyledLayer('etopo1_dem',
   ...> XB_Create(XB_LoadXML('./etopo1_styles/etopo_categorize.xml'), 1, 1));
1
sqlite> SELECT RegisterRasterStyledLayer('etopo1_dem',
   ...> XB_Create(XB_LoadXML('./etopo1_styles/terrain.xml'), 1, 1));
1
sqlite> SELECT RegisterRasterStyledLayer('etopo1_dem',
   ...> XB_Create(XB_LoadXML('./etopo1_styles/srtm_plus.xml'), 1, 1));
1
sqlite> .quit
$
This step exactly corresponds to the task already explained in the Trieste and Orbetello tutorials.
Step 5) testing the ETOPO1_DEM sample (and playing with Styles)
As you've already done in any previous tutorial you can now directly test the ETOPO1_DEM Coverage by publishing a standard WMS service.You simply have to start the wmslite light-weight server, then connecting some WMS viewer (e.g. LibreWMS) to the service being published on localhost aka IP address 127.0.0.1, port 8080.
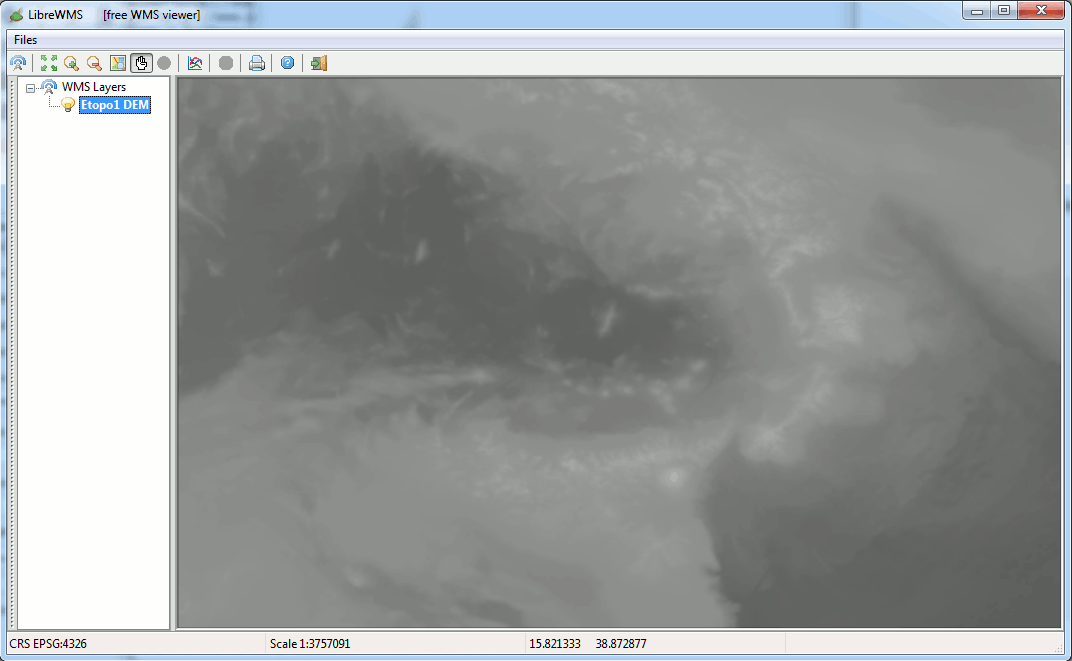
This first example corresponds to the default Style (no RasterSymbolizer at all): in this case just a basic Grayscale rendering is applied. Not a really interesting option.
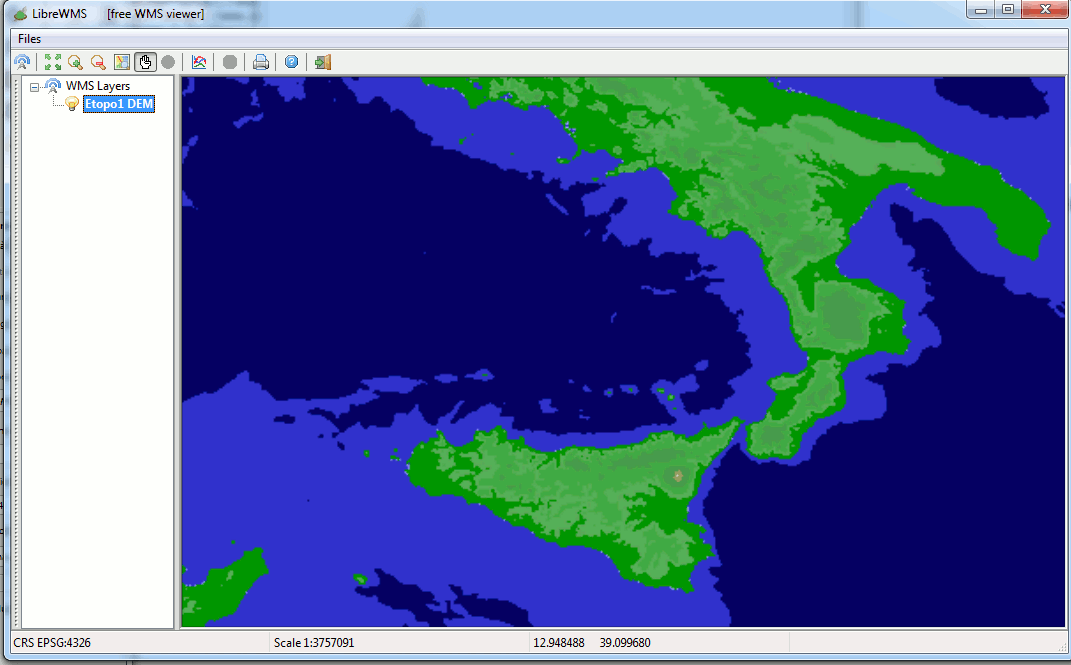
This second example corresponds to the etopo_categorize style.
You can now fully appreciate what a ColorMap of the Categorize type really means; all elevations falling within the same class interval have the same identical color, and the final result is an unpleasant ugly map.
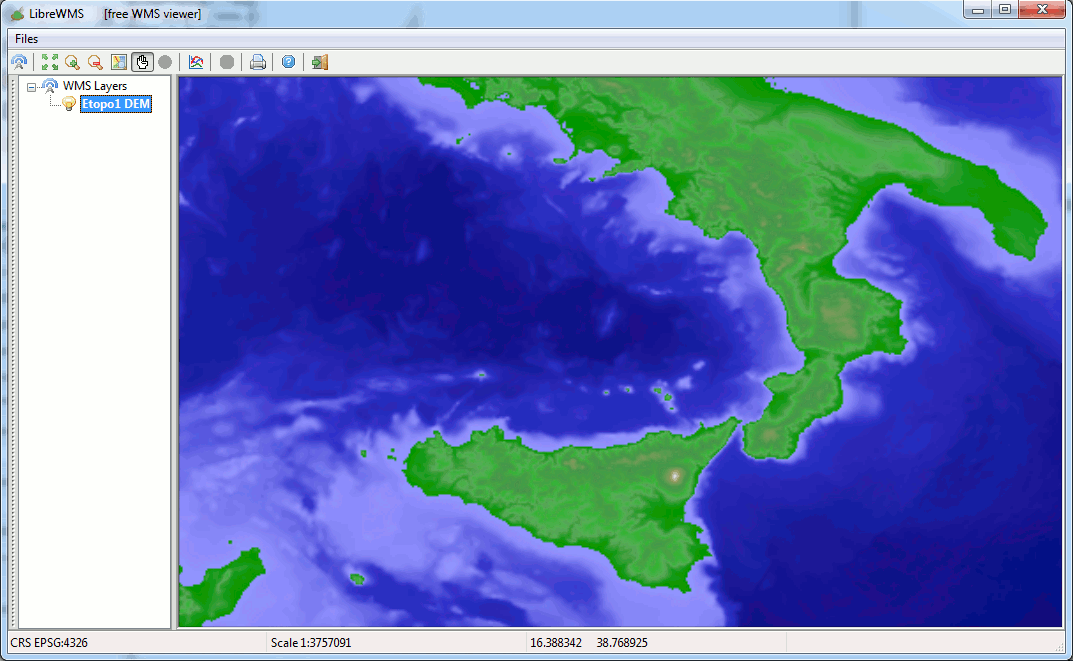
This third example corresponds to the etopo style; now the ColorMap is of the Interpolate type, and the final result is much more brilliant then before.
Please note well: both the etopo_categorize and the etopo style share exactly the same identical ColorMap; but the etopo style supports the Interpolate rendering, thus producing a wide range of different color shades, and the overall effect surely is a pleasant one.
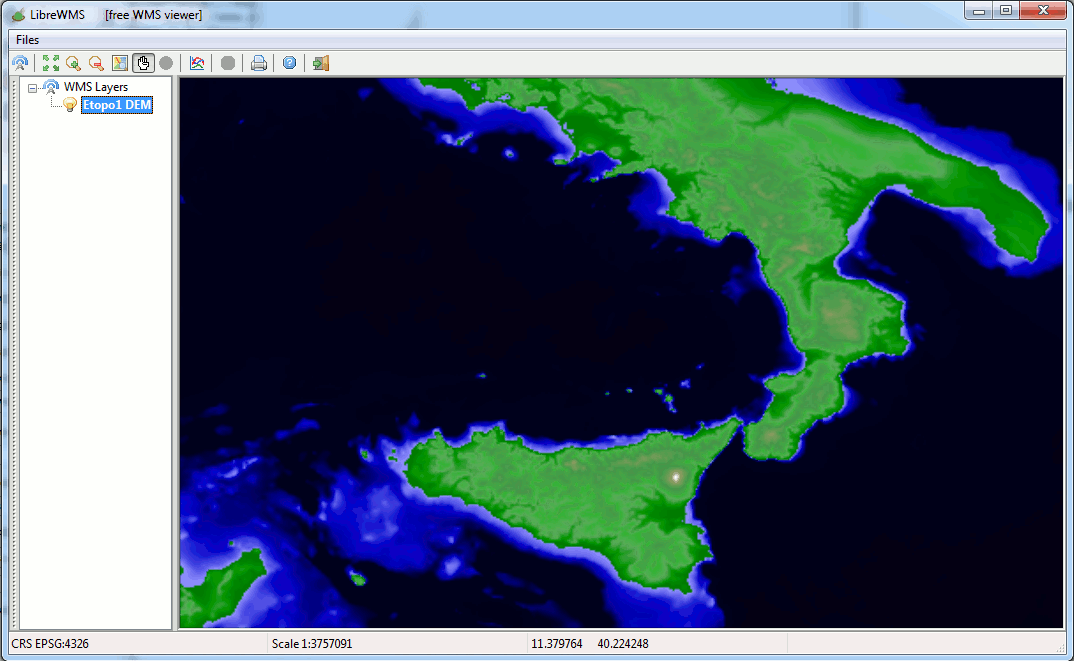
This fourth example corresponds to the terrain style; it's very similar to etopo, but in this case deep waters are simply represented as black areas, so to focus the attention on Lands and nearby shallow waters.
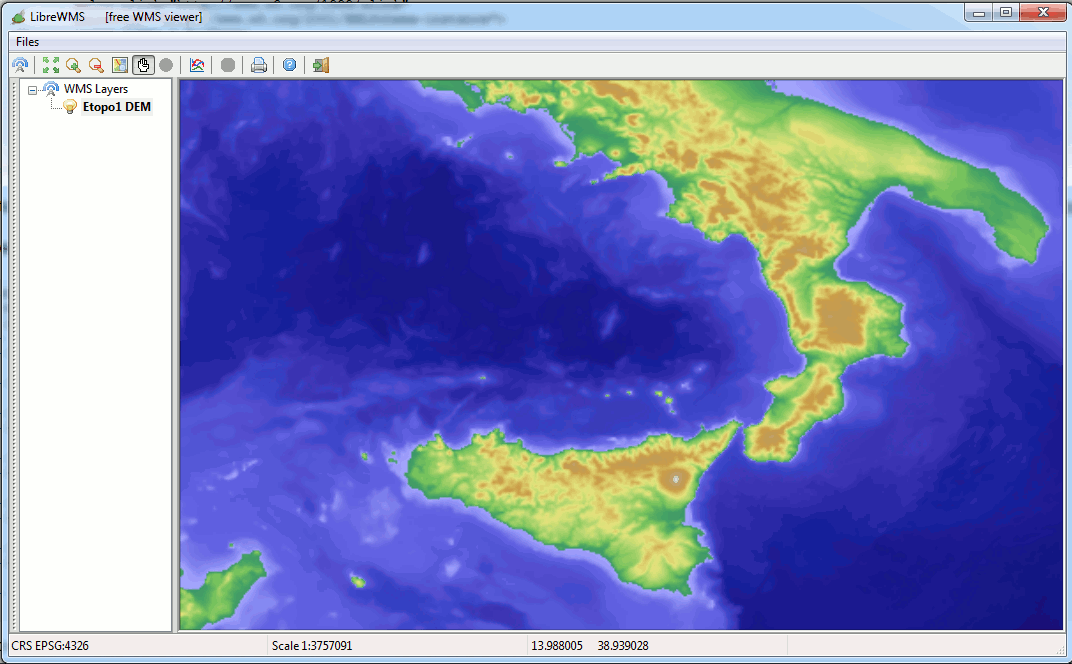
This final example corresponds to the srtm_plus style. As you can easily notice, it's not at all difficult creating completely different maps starting from the same identical DEM Coverage; you are simply required to define few alternative Styles and that's all.
And using the standard capabilities supported by the WMS protocol switching from a Style to the other can be performed in the most simple and dynamic way.
Back to RasterLite2 Tutorials index